Analysis 
Samples and analysis
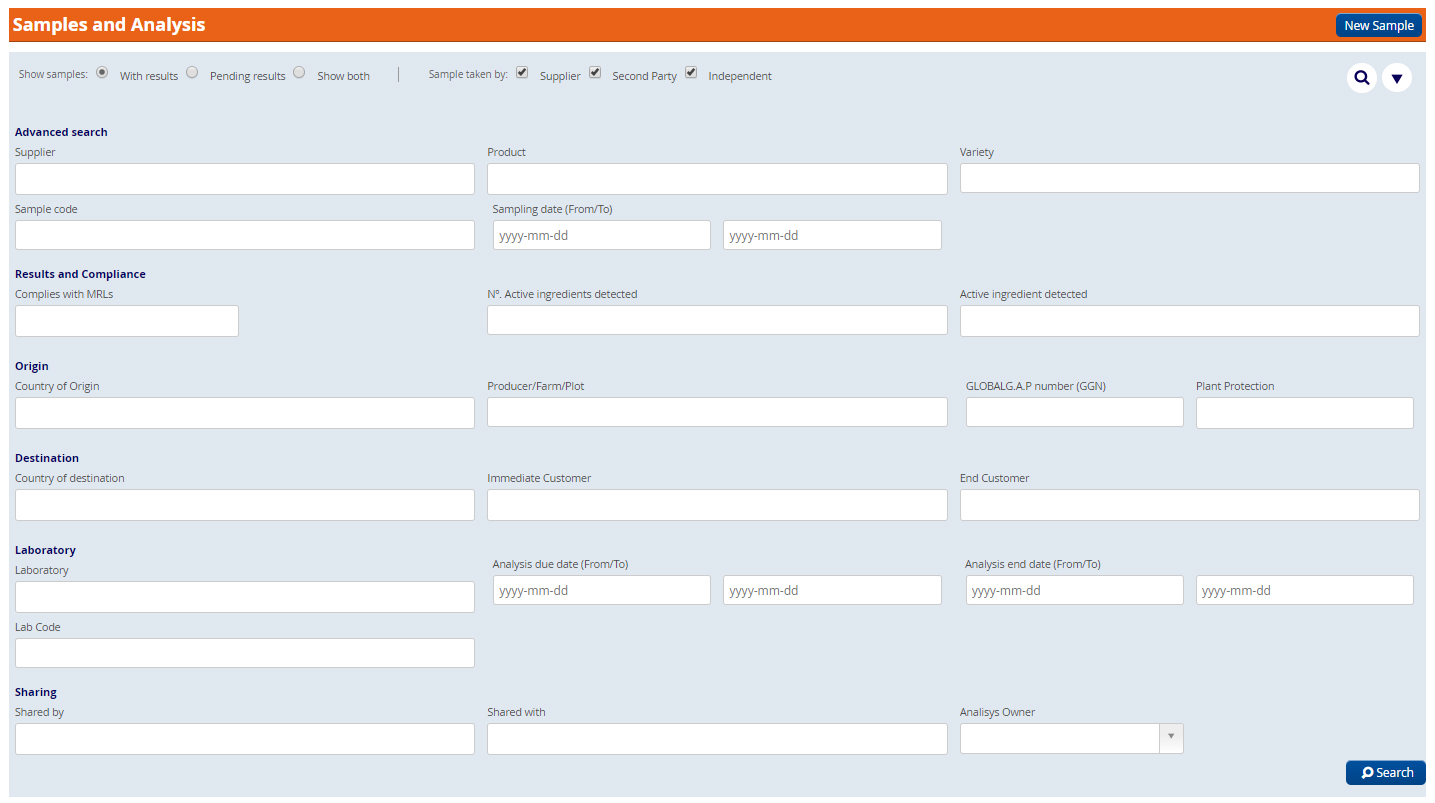
The "Samples and Analysis" section allows the user to see the samples and their results. Using the search panel filters, the user can easily select which samples to see.
You can perform the search by samples with a loaded result, without a loaded result or both.
In addition, the user can select samples of first (self-control), second (intermediate) and / or third (independent).
The magnifying glass icon allows a quick search.
If the user wishes to search for a specific sample, user can do so by selecting the triangular button in the upper right corner. The advanced search panel allows you to search for samples by suppliers, products, sample code, date of sampling, country of origin, laboratory, etc.
The results will be displayed in a table that, by default, shows the following fields: sample code, product, variety, supplier, producer, sampling date, origin and number of active materials detected. The user can decide to include other fields such as destination, traceability, laboratory, client, shared with and shared by. In More, you can share the result, view details, load application records, modify or delete the sample if you have permissions.
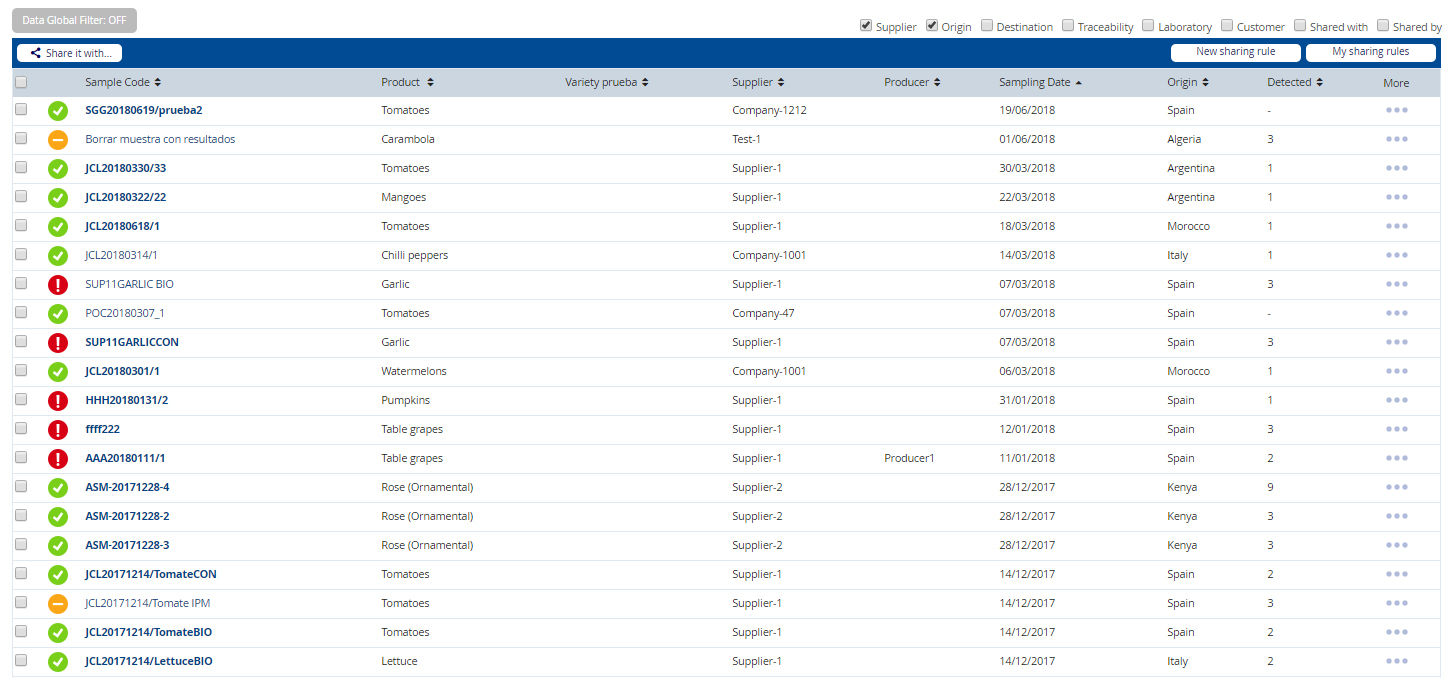
All this information can be downloaded in Excel format to be processed and make statistics at the end of the campaign. This information can be downloaded using the "Download XLS" button in the lower right corner. You can choose the number of samples that appear on the screen through the "show" drop-down, from 20 to 1000.

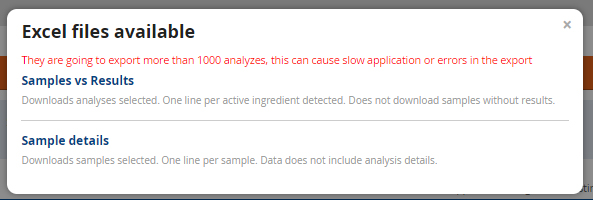
The information can be downloaded structured in two formats:
- Samples with analytical results. Details of the detected active matters, the value and profile for each sample.
- Samples without including analytical results. Includes only the information related to sampling.
Statistics
The platform allows to automatically generate statistics to process the analytical results according to the needs of the user.
Available statistics are:
- Number of samples based on the percentage of LMR detected.
- Number of active substances detected, on average, per sample of each product.
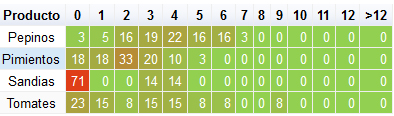
- Percentage of samples in which a number of active ingredients per sample are detected.
- 71% out of the watermelon samples, no active material was detected.
- 33% out of the pepper samples, 2 active materials per sample were detected.
- 22% out of the cucumber samples, 4 active materials per sample were detected.
- Exhaustion of MRLs, on average, per sample of each product.
Statistics can be structured by product, country of origin and supplier.